As we say goodbye to 2011, here are this year's most-viewed items from this blog:
5/4. In a tie for 4th place were the Solar Energy Infographic and the cartoon Window of Opportunity.
3. My Queensland Floods roundup presented some amazing photos, alongside some interesting commentary from experts.
2. Another cartoon in the top 5 was Discussion Postponed - a humorous take on the effects of climate change on extreme weather.
1. The most viewed item here this year though has been the Climate Action Support Rally pics. It was great to have such a positive supportive day - even if it was a shock to some. I heard one reporter asking her cameraman to film her with the 'protesters' in the background. Obviously a group of people gathering together to support something was a new thing to her. ;)
Saturday, December 31, 2011
Wednesday, December 21, 2011
Christmas Present
The people at 100% Renewables have started an interesting campaign for Aussies to send a Christmas card to the local MP, asking for a particular present - Big Solar Power!

You can download the print or email version of the Christmas card, find the address of your local pollie - and post it off to them.
ps. the card looks much better at full size
pps. the picture is of solar thermal - more info on that here and here.

You can download the print or email version of the Christmas card, find the address of your local pollie - and post it off to them.
ps. the card looks much better at full size
pps. the picture is of solar thermal - more info on that here and here.
See more about:
government,
renewables
Friday, December 16, 2011
How Does Your Country Rank?
One of many things that happened during the recent global climate change talks in Durban was the release of the Climate Change Performance Index.

It ranks the nations according to how well they're doing on tackling carbon emissions - kind of like an Olympic medal tally, or sports league. Unlike sports, the news was not good for Australia - finishing in the bottom grouping.

My country ranked 48 - not far from the bottom (61). However the report contained some positive remarks about Australia:
[Link: The Results Tables]

It ranks the nations according to how well they're doing on tackling carbon emissions - kind of like an Olympic medal tally, or sports league. Unlike sports, the news was not good for Australia - finishing in the bottom grouping.

My country ranked 48 - not far from the bottom (61). However the report contained some positive remarks about Australia:
Australia has made encouraging steps towards improved climate policy. The experts recognized the new carbon tax as especially positive. Due to continuously high emissions, Australia remains in the last quarter of the CCPI. However, the latest emissions trend and the policy evaluation made Australia climb ten ranks and indicate that Australia has the ability to climb up in future rankings."climb ten ranks"?! We must have been down at 58th last year. Ouch! But we have the ability to climb further up the ladder - that's good. How did your country do?
[Link: The Results Tables]
See more about:
government,
graphics,
info,
sport,
theworld
Monday, December 12, 2011
What's Your Carbon Price
As Australia decided to bring in a carbon price, i probably mentioned the wild exaggerations by those opposed to the change. Now that the dust has settled, experts have analysed the details of the policy to bring back some reality and perspective.
At Your Carbon Price everyday Australians can answer a few basic questions to estimate (a) how much (or little) our costs might change, and (b) how much we'll receive in tax cuts and other assistance. Here's mine:

As you can see from my analysis, the tiny impact of $5.70 per week, is easily offset by the $5.83 reduction in my income tax. I'd be interested to hear how the numbers came out for your situation.
To add further perspective, i read that the average Australian spends $30 per week on alcohol.
[Related link: The Facts On Food]
At Your Carbon Price everyday Australians can answer a few basic questions to estimate (a) how much (or little) our costs might change, and (b) how much we'll receive in tax cuts and other assistance. Here's mine:

As you can see from my analysis, the tiny impact of $5.70 per week, is easily offset by the $5.83 reduction in my income tax. I'd be interested to hear how the numbers came out for your situation.
To add further perspective, i read that the average Australian spends $30 per week on alcohol.
[Related link: The Facts On Food]
Friday, December 09, 2011
This Is George
This entertaining little video was put together by a group of amateur producers, designers, animators and artists. They realised that not enough people understand that emissions from human use of fossil fuels cause climate change. In a few short weeks they put together this short film.
'This is George' is the story of a human called George, a plant called a sunflower, and the connection they both have to climate change.
Thursday, December 08, 2011
PRE Christmas Bargains
A great site for books on climate change is Sustainable Insight (i'm sure i've mentioned them before). Anyway they are now having a 20-30% off sale.

So if you're looking for a bargain, now is the time to get that book you've been thinking of. (Note: the sale excludes ebooks).

So if you're looking for a bargain, now is the time to get that book you've been thinking of. (Note: the sale excludes ebooks).
See more about:
books and dvds
Wednesday, December 07, 2011
Climate Change and Health
Last week i shared some data about hot days where i live. Coincidentally, Australia's Climate Commission then released their new report Climate Change and Health.

It made the point that "Climate change is a serious threat to our health and well-being". A hotter climate leads to more heat-related deaths and infectious disease. More frequent and severe extreme weather events threaten our physical and mental health.

It made the point that "Climate change is a serious threat to our health and well-being". A hotter climate leads to more heat-related deaths and infectious disease. More frequent and severe extreme weather events threaten our physical and mental health.
Tuesday, December 06, 2011
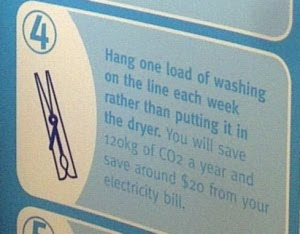
Tip 4 - Pegs
I'm sure i've mentioned this one before, but clothes drying (with pegs or a clothes rack) has to be one of the cheapest ways of using solar and wind power. :)

According to the poster, just one load per week saves 120kg of greenhouse gas and about $20. Again, those dollar savings get bigger as power prices rise. And (if you don't have one already) you save hundreds by not buying a dryer.
< Tip 3 ::

According to the poster, just one load per week saves 120kg of greenhouse gas and about $20. Again, those dollar savings get bigger as power prices rise. And (if you don't have one already) you save hundreds by not buying a dryer.
See more about:
renewables,
savepower,
tips
Monday, December 05, 2011
Repower Promo
The AYCC did this great promo design for their current petition to Repower Australia with renewable energy. :)


See more about:
government,
renewables
Friday, December 02, 2011
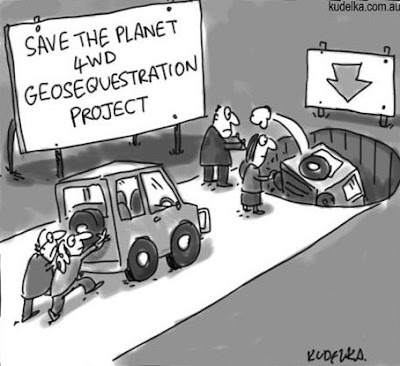
Geosequestration That Might Work :)

Normally geosequestration refers to the condensing, compressing and burying underground of greenhouse emissions from fossil fuel based power stations (and crossing our fingers that they stay down there). There are a number of questions about it - not least of which is why would we bother when renewables would be cheaper than that whole process.
So it amused me to see a different suggestion of how we could bury something if we want to reduce our pollution :)
See more about:
funnies
Thursday, December 01, 2011
How The Media Dupes Us
I've done a few pieces on climate change in the media, and the lack of journalistic rigour. [Links: 1 2 3 4] Now the stats are here to prove it.
The Australian Centre for Independent Journalism (University of Technology, Sydney) has released a study A Sceptical Climate.

The study of 3971 articles across 10 Australian newspapers, on the topic of carbon policy produced some interesting stats.
73% Negative, 27% Positive (excluding neutral articles). It was 82-18 in News Limited papers. Fairfax papers, a more balanced 43-57.
Scary headlines sell papers. Even neutral articles were given twice as many negative headlines (41%) than postive ones (19%). Just ask Gail Kelly :)
Negative language. 51% of articles referred to a "carbon tax" (the prefered term of opponents) while just 11% used the term "carbon price" (the prefered term of proponents). In News Limited papers it was 70-8.
Who gets the microphone? Business received more coverage than all civil society sources combined (unions, NGOs, think tanks, activists, members of the public, religious spokespeople, scientists and academics). Within business, fossil fuel companies and the like received far more coverage than clean energy and supportive businesses.
That's the quick guide to how a media can dupe the unsuspecting reader. For more detail and stats, check out the full report. For Aussies, it's also interesting to see what coverage is like in your state.
[Link: Full Report]
The Australian Centre for Independent Journalism (University of Technology, Sydney) has released a study A Sceptical Climate.

The study of 3971 articles across 10 Australian newspapers, on the topic of carbon policy produced some interesting stats.
73% Negative, 27% Positive (excluding neutral articles). It was 82-18 in News Limited papers. Fairfax papers, a more balanced 43-57.
Scary headlines sell papers. Even neutral articles were given twice as many negative headlines (41%) than postive ones (19%). Just ask Gail Kelly :)
Negative language. 51% of articles referred to a "carbon tax" (the prefered term of opponents) while just 11% used the term "carbon price" (the prefered term of proponents). In News Limited papers it was 70-8.
Who gets the microphone? Business received more coverage than all civil society sources combined (unions, NGOs, think tanks, activists, members of the public, religious spokespeople, scientists and academics). Within business, fossil fuel companies and the like received far more coverage than clean energy and supportive businesses.
That's the quick guide to how a media can dupe the unsuspecting reader. For more detail and stats, check out the full report. For Aussies, it's also interesting to see what coverage is like in your state.
[Link: Full Report]
See more about:
info
Subscribe to:
Comments (Atom)