Wednesday, September 30, 2009

Cartoons

So the other day, i received a comment about cars and trains from Stuart McMillen.


I've met Stuart a few times in 'real life' and (aswell as being a very amiable fellow) he does some very thoughtful cartoons. It occurred to me that i've never shown these to you - so i'm rectifying that now.

Friday, September 25, 2009

Special Edition - New York Post

Serial pranksters, the Yes Men distributed copies of a fake version of the New York Post this Monday in New York. While the paper was fake (not really by the NY Post) the articles were real.

Like any paper it covers weather, sports, politics, business, movies and celebrities. It has comic strips - and news on Pamela Anderson.

Why am I telling you this? Every story relates to climate change, and tells it like it is. The lead story "We're Screwed" is about a report by New York City on the disatrous effects of climate change for those in the Big Apple. Andy Bichlbaum of the Yes Men had this to say..

This could be, and should be, a real New York Post... Climate change is the biggest threat civilization has ever faced, and it should be in the headlines of every paper, every day until we solve the problem.

Check out the paper online or in pdf.

Thursday, September 24, 2009

Hot August Nights (And Days)

Wasn't it a warm winter? Well yes, it turned out to be Australia's warmest August on record, according to the Bureau's Special Climate Statement. It's one thing for Brisbane to be hot, but this is nationwide.

Yellow and orange mean warmer than average. Deep orange indicates record temperature. White is average, and (if you can see any) blue means cooler than average.
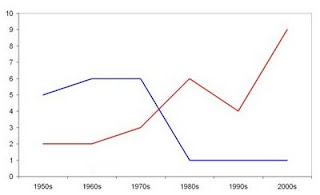
Of course, one month doesn't mean that much. But then i found this graph of the number of extreme months over the decades. (red for hot months, blue for cold)


One hot day doesn't mean global warming, but when it's hot everywhere - and more and more frequently - that's the concern.

Wednesday, September 23, 2009

Dusted Up

It seems everyone's talking about the dust storms - including the scientists on the IPCC. The ABC tells me that the IPCC report predicts an increase in dust storms with climate change, as the conditions that cause them increase.

The same article estimates that the storm contains at least 8 million tonnes of dust. For statistics buffs, we put the same amount of carbon dioxide in the atmosphere every 2hr 45 minutes. (based on this rate)

Tuesday, September 22, 2009

The Youth Have Decided

So I saw this ad for Youth Decide - an website for young people to show their desire for action on climate change.


I checked out their website, and the vote is very overwhelming, with 91.5% voting for greenhouse gas reductions at least 40% by 2020.

Monday, September 21, 2009

Understanding Science

Interesting report on Lateline about shrinking public knowledge of science - and why this might be.


It's followed up by a discussion with Chris Mooney (author of Unscientific America) about the impacts of the public being "clueless" on science. One such result is that science is attacked on the basis of political (or other) persuasions. For instance, US polling shows that a key factor of opinion on global warming is the person's preferred political party (rather than anything related to science).

Friday, September 18, 2009

Friday Funnies

I was emailed this cartoon, from the August edition of the Big Issue.

Thursday, September 17, 2009

Car Versus Train

So Queensland Rail now have an Emissions Calculator for Citytrain trips. Just enter your start and finish stations, and it works out the emissions by train and by car - and how much pollution you saved by taking the train.


The train graphic adds a little something to the experience :)
---------------------
Update: With the changes to QR, the calculator is now located at http://www.queenslandrail.com.au/Community/Pages/Emissions.aspx

Wednesday, September 16, 2009

Electric Car Report

Last night, ABC's 7.30 Report had a piece on the coming electric cars (starting next year apparently) described as the biggest industrial transformation of our generation.


The report includes comment from Better Place, Mitsibushi (makers of the iMiev pictured above) and Professor Michael Roberts of Sydney University.

Tuesday, September 15, 2009

Last In The Class

With the G20 nations meeting next week, the Climate Institute have released a report ranking the nations on their greenhouse performance - and it's pretty embarrassing for Australia.

In ability to meet greenhouse reduction targets, Australia is at the back of the field, with only Saudia Arabia, Russia and Turkey behind us. For ability to do business in a low-carbon world, Australia was last of the industrialised countries.

"It is an economic challenge, not just an environmental challenge, and one which we need all of our political parties to be focussed on" said John O'Connor of the Climate Institute, who described the results as "a wake-up call for our leaders, both the Prime Minister but also to Malcolm Turnbull."
This is something which puts our jobs and living standards at risk if we don't get on with economy-wide measures to change our economy to cut carbon pollution and to increase our productivity.
Climate Institute report: download
ABC News coverage

ps. this comes on top of Friday's report by a British Group, that Australia is now the worst polluter in the world.

Monday, September 14, 2009

The New Swap 'n' Go

A clip from Better Place, showing how electric battery exchange is quicker than filling up with petrol.


Of course, this would be a rarity for most urban drivers. Ordinarily, it recharges overnight. But for driving hundreds of kilometres in one stretch, the occasional battery switch would be in order.

Thursday, September 10, 2009

Ten Technologies To Save The Planet

For this one, the name really does say it all. Chris Goodall examines in depth each technology, it's advantages and any limitations - but also busts some myths.


Overall, he points out that we have the technology to address climate change. Also, as he reminds us early on in the book, the more we use renewable sources (eg. wind) the more the price comes down - the more we use fossil fuels (eg. oil) the more the price goes up. Surely it's a no-brainer - isn't it?

Wednesday, September 09, 2009

Options

Just discovered some great little cartoons at a place called inkcinct - like this one.

Tuesday, September 08, 2009

Carbon Capture Still Elusive

Last night ABC's Four Corners program did a report on The Coal Nightmare. It focussed mainly on carbon capture, and how so far nothing has really come of it.


While it was meant to extract carbon dioxide from coal plants, it seems the only things it's extracting is taxpayer's money. Or as Professor Mark Diesendorf puts it:

And what we're seeing in Australia is billions of dollars being poured down the drain in order to satisfy the demands of the coal industry, which is an incredibly wealth industry, which is not prepared to make most of the investments itself.


Coincidentally, on the same day, the Brisbane Times ran a story on carbon capture and storage being still just a pipe dream.

Thursday, September 03, 2009

Brisbane Sticker

I've mentioned the Climate Smart Home Service before. And, of course, if you are a Brisbane resident, the council will re-imburse you the $50 fee.


As a little bonus, you get a free sticker in the mail, along with your $50 cheque. (no photo of the cheque - straight into my account :)

Wednesday, September 02, 2009

CO2 Cubes

The people at Millenium Art are making something abstract (like a tonne of carbon dioxide) into something visible (like a huge cube). This image shows the size of 1 tonne of CO2. For scale, that little thing at the bottom right is a person.


Scarier still is the rate at which we pump out these 'cubes'. According to the website, in developing countries the average person takes 3 months to emit 1 tonne. In industrialised countries, it's about one month. In the US (and Australia's about the same) the average person puts out a tonne every 2 weeks.

Tuesday, September 01, 2009

Stick It In The Bin

I scored one of these stickers that lists what can and can't be recycled - now handily located inside of the bin lid.


Today I saw the following figures for the energy savings achieved by recycling:
Aluminium - 95%
Plastics - 90%
Steel - 62-74%
Paper - 60%
Glass - 33%

Those are massive energy savings, just for putting something in a different bin.