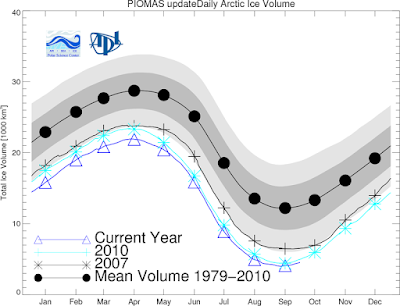
The black dots are the 30-year averages. The crosses are 2007 and the 2 blue lines are the last 2 years. September 2011 was the lowest point so far, as we get closer to having no arctic ice.
So here's your chance to play amateur-scientist. Using this and other recent graphs at the Arctic Sea Ice Blog - make a prediction. When do you think the Arctic will first lose all its ice?
No comments:
Post a Comment